
Flow
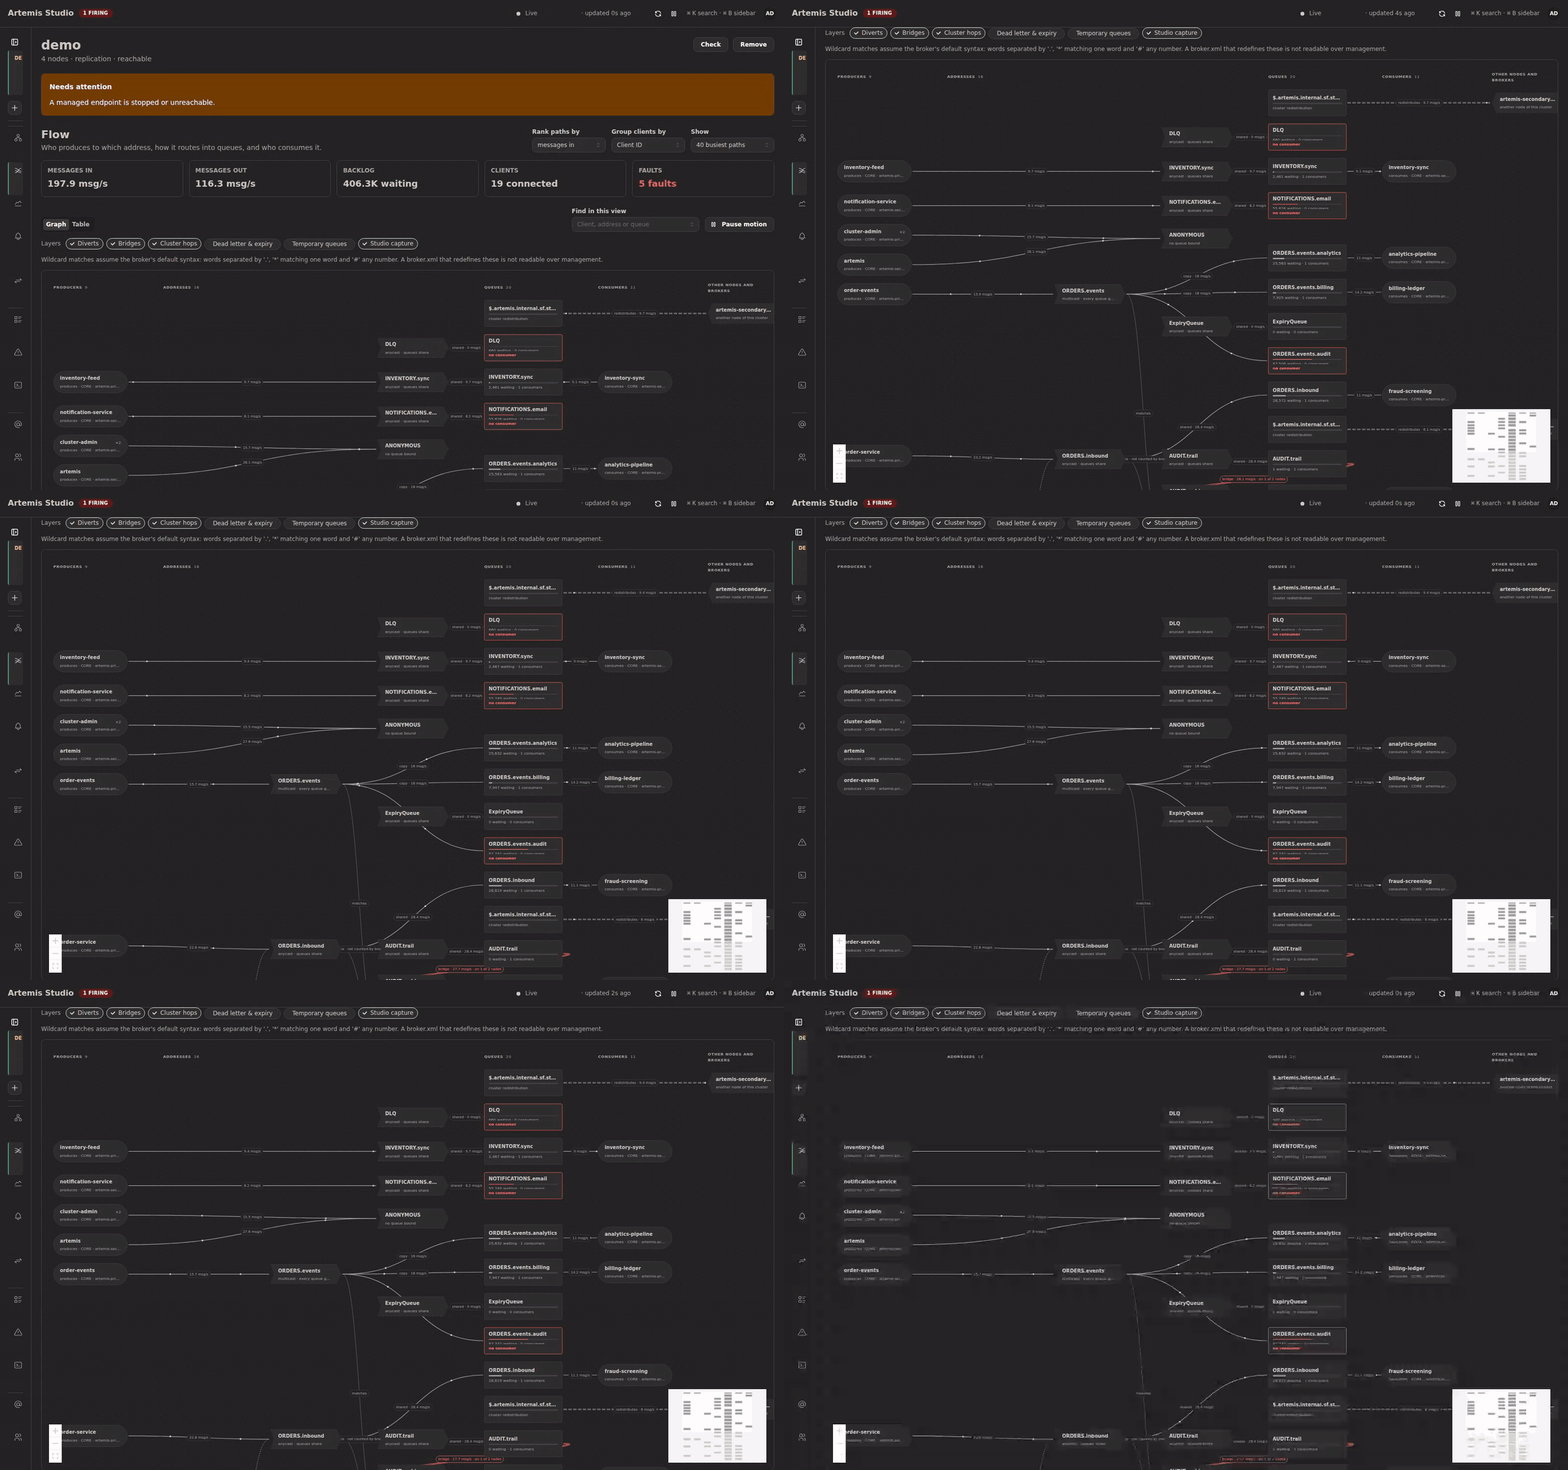
The question an operator asks mid-incident is rarely "what is in this queue". It is "who sends here, where does it go, and why is it piling up?" Artemis answers each part on a different screen — connections in one list, consumers in another, diverts in broker.xml — and never the whole path at once.
Flow draws the whole path, for a cluster, in one view:
producers → addresses → queues → consumers, with diverts, bridges and the hops between cluster nodes drawn around them.
Reading the graph
Columns run left to right in the direction messages travel. Shape says what a node is, so nothing depends on colour:
| Shape | Is |
|---|---|
| Pill | A client — grouped by client id, user or host (your choice, in the toolbar) |
| Tag | An address, with how it delivers: every queue gets a copy (multicast) or queues share (anycast) |
| Box | A queue; the bar under its name is its backlog against the deepest queue shown |
| Hexagon | Another node of the cluster, or a bridge target outside it |
An edge's thickness and its label carry the rate, and dots move along it — faster and denser as the path gets busier. A dashed line is idle; a dotted one is still being measured. Colour appears only when something is wrong, and the problem is also named in words: no consumer, stalled, not connected, on 1 of 2 nodes.
Hover or focus any node and the full upstream and downstream path through it stays bright while the rest fades. Select it to open its details: its figures, the flow into and out of it with each rate's source and age, and buttons to focus the view on it or open it in Queues, Consumers, Producers or Connections. Flow itself never changes the broker.
The Table view lists exactly what the graph draws, sortable, for keyboard and screen-reader use or for copying into a ticket.
Bounded, on purpose
A production cluster has thousands of queues. Flow opens on the 40 busiest paths, ranked by messages in, messages out or backlog, and always says how many it left out:
Showing 40 of 1,212 paths, ranked by messages in.
The totals at the top cover every path, not only the shown ones. To reach the rest, raise the limit (the server draws at most 200), or focus the view on one client, address or queue and widen it hop by hop. Focus, ranking, grouping, layers and the table sort are all in the URL, so a link restores the same view.
Ranking uses half-decade buckets, so two paths whose rates differ by a few percent do not swap places on every refresh, and a refresh that only changes rates never moves a node.
Where the rates come from
Every rate says where it came from and how old it is:
| Source | Used for |
|---|---|
| Sampled clients | Producer → address and queue → consumer, from each client's own counters |
| Queue metrics | Address → queue, from the scrape Studio already runs. A queue refreshed only by the slow sweep says ~5 min average |
| Broker keeps no count | Diverts. Artemis does not count what a divert moves, so Flow draws the divert and says so rather than inventing a number |
A rate that cannot be computed yet reads measuring… — never 0, which would look like a path that stopped.
Studio only samples while you are watching
Per-client rates are not something the broker keeps, so Flow samples them — only while a Flow view is open on that cluster. The open view renews a short lease; about a minute after the last one closes, sampling stops and the brokers see no extra traffic from Flow at all.
While a view is open, each sweep sends one request per serving node, carrying everything Flow needs: producers, consumers, diverts, bridges, store-and-forward, temporary and filtered queues, and the dead-letter and expiry addresses. It counts against the same per-node rate limit as every other Studio call. With several Studio instances, one samples and all of them show the same result.
On a very large node, the number of producers and consumers read per sweep is capped. When a node has more, Flow says how many it read out of how many exist, rather than presenting a partial answer as a whole one.
Layers
Routing is drawn in layers you switch on and off in the toolbar:
| Layer | Draws | Default |
|---|---|---|
| Diverts | An address rerouting (exclusive) or copying to another. An exclusive divert without a filter marks its address's own queues bypassed | on |
| Bridges | A queue forwarded to an address here or on another broker; not connected when it is down | on |
| Cluster hops | Messages a node moves to another node through its store-and-forward queue | on |
| Dead letter & expiry | Where a failed or expired message from each shown queue goes | off |
| Temporary queues | One node per client for all its short-lived reply queues | off |
| Studio capture | Studio's own capture taps, marked as Studio's | off |
A queue bound to a wildcard address such as orders.# is joined to the concrete addresses it matches. That match assumes Artemis' default wildcard syntax, because a broker.xml that redefines it is not readable over management — the view states the assumption whenever it draws one.
When something is missing, Flow says why
- A node that did not answer is named, with the statement that its clients are not shown.
- A node that refused to list clients is named with the
management.xmlaccess that grants it. - A node whose routing could not be read still shows its clients, and says its diverts and bridges may be missing.
- A broker that does not report the counters a rate needs shows rate unavailable, not zero.
Motion and accessibility
Motion can be paused from the toolbar, stops on its own when the tab or the graph is out of view, and is not drawn at all when your system asks for reduced motion — width and labels still carry every rate. Every node is reachable with the keyboard; Enter opens its details and Escape closes them, returning focus to where it was.
Settings
Under Settings → Flow, without a restart:
| Setting | Default | |
|---|---|---|
| Sampling interval | 15s | Never below 10s |
| Rows read per node | 5000 | The most producers, and the most consumers, read from one node per sweep |
| Observation lease | 60s | How long sampling continues after the last Flow view closes |
Viewing Flow needs cluster:read. The design is recorded in ADR-0080 (layout and motion) and ADR-0081 (sampling).